Last time I asked if you could find the bug in the original version of my histogram code. Here’s how I found it:
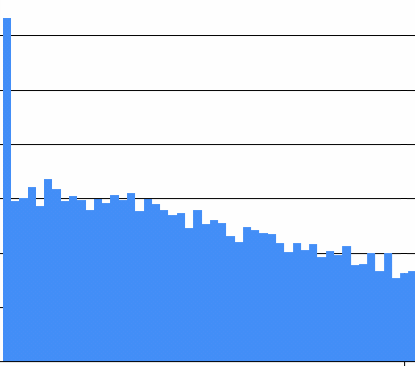
The first time I ran my histogram visualizer I asked for a Cauchy distribution with a minimum of -10 and a maximum of 10, and of course I got a graph that looks much like the one from my article of last week:

Looks perfectly reasonable; I guess my program is correct right out of the gate, because I am that awesome!
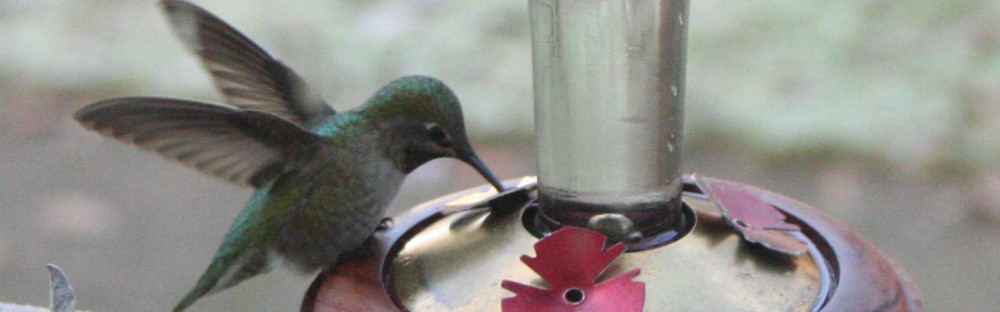
Then I went to make a graph of a uniform distribution with a minimum of zero and a maximum of one, but I forgot to update the actual query; it still gave me a Cauchy distribution. Here’s that same Cauchy distribution this time graphed only from 0 to 1. Oh, the pain:
Which is obviously neither uniform nor Cauchy. Equally obvious: I am not sufficiently awesome to write a twenty-line program without a trivial floating point bug the first time.
The bug, which is very subtle in the first graph, was now obvious: the calculation to determine what the count is for the leftmost bucket is wrong. Why? Because converting a double to an integer simply discards the fractional part, effectively truncating towards zero, and “towards zero” is not downwards if any datum is negative. That means that the leftmost bucket got everything that was supposed to be in it, and everything that was supposed to be in the bucket to its left as well! The solution is either to take the floor of the number before turning it into an int, or to check to see if the double is in the right range before truncating it, not after.

Pingback: A simple puzzle | Fabulous adventures in coding